A question that stakeholders, project managers, and product owners ask in common, when it comes to shipping or releasing software products:
- When will it be done?
This question can be answered by using a burn-down chart. Such charts can also predict when the product will be a usable, quality product. To predict this, add certain user-research findings to the chart.
Agile teams often use a burn-down chart to show the team’s progress after each sprint, or work period. The chart shows work as estimated points. A typical burn-down chart focuses on completed work versus the total estimated work:
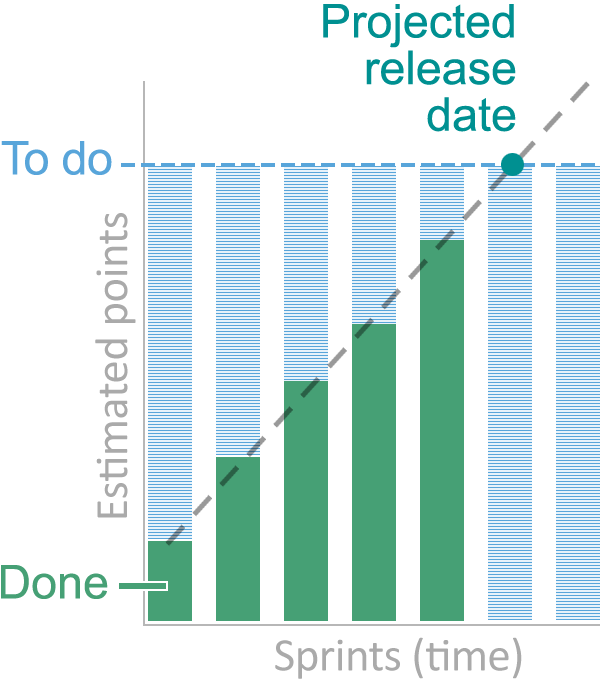
An interpolated line on the burn-down chart lets the team predict when the total estimated work will be completed. The example burn-down chart, above, shows this will occur in sprint 6. At that time, the development team will have completed the originally estimated work.
But is the work usable…?
No development work is consistently perfect; there will be defects. Some defects can be ignored, others must be fixed. No defect can be fixed until it’s identified. Many defects can be identified through a standard quality assurance process. Other defects can only be found with the help of users—by usability testing.
There’s no need to wait until the product is released to identify usability defects. After every sprint, a user researcher can usability-test the previous sprint’s completed work. By giving users sample data and plausible scenarios to try, a user researcher can identify usability issues, if any. Early testing means the product is still incomplete, so some issues will reflect missing functions, and can be flagged for later re-testing. But the user researcher may also identify some major usability defects.
If major usability defects are not fixed, the product will in effect be broken on its release date. Fixing the major usability issues before the release date is high priority.
You can plan for unknown, high-priority usability defects. Using the previous sprint’s usability test results, at the start of each sprint the team can estimate the high-priority usability-defect points, and add them to the burn-down chart. They are piled on top of the total estimated points:
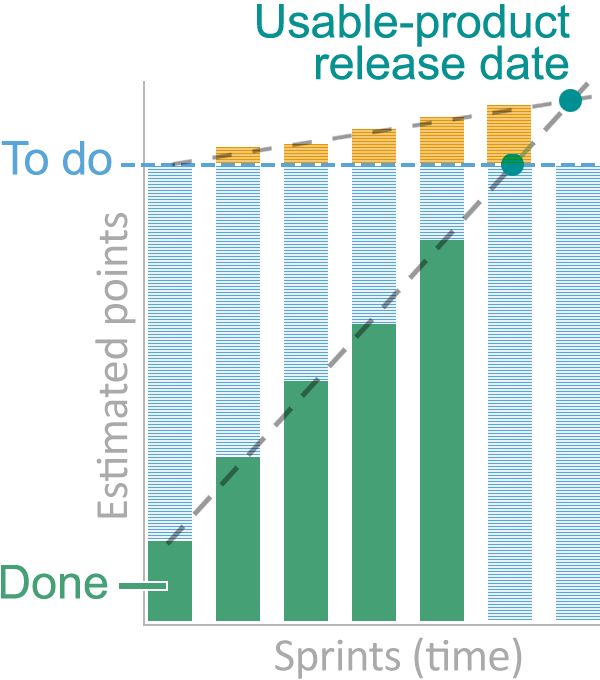
After a few sprints, a second interpolated line on the burn-down chart lets the team predict how many high-priority usability-defect points are likely coming. Where the two interpolated lines cross identifies the sprint in which a usable product is ready to release.
How do you get usability-defect points?
You don’t need to fix all usability defects. You don’t even need to fix all major usability defects. You need to predict the work needed to release a quality product. Here’s how:
- After each sprint, conduct a usability test of the previous sprint’s output. Use discount usability testing with 5 or 6 participants who resemble the intended users of the product features you’re testing. This will identify about 80% of major usability issues. Norman Nielsen Group describes the method, and MeasuringU discusses the reliability of findings based on small sample sizes.
- Decide which of the major usability defects are high priority—consider financial, legal, and reputational risk for you and your customers, and consider your extra support costs and your customers’ total cost of ownership, such as training or lost opportunity cost.
- Identify which high-priority usability defects could be fixed by upcoming development work in the originally estimated points. For those, add notes to the requirements, or stories, of that upcoming development work.
- Similarly, decide which of the high-priority usability defects can’t be fixed by upcoming work, and so need to be addressed separately. For that work, ask the development team estimate the points, just as they do for any other Agile development work. You can then add these points to the burn-down chart.